
status
type
date
slug
summary
tags
category
password
icon
关联关系
AI 摘要
逆相关 铃溪的Blogs
Total Videos
Link
Video Duration
pyplot的基础图标函数
函数 | 说明 |
plt.plot(x,y,fmt,...) | 绘制一个坐标图 |
plt.boxplot(data,notch,position) | 绘制一个箱型图 |
plt.bar(left,height,width,bottom) | 绘制一个条形图 |
plt.barh(width,bottom,left,height) | 绘制一个横向条形图 |
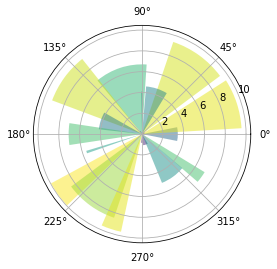
plt.polar(theta,r) | 绘制极坐标图 |
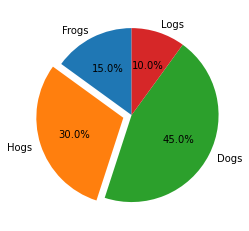
plt.pie(data,explode) | 绘制饼图 |
plt.psd(x,NFFT=256,pad_to,Fs) | 绘制功率谱密度图绘制谱图 |
plt.specgram(x,NFFT=256,pad_to,F) | 绘制散点图 |
plt.cohere(x,y,NFFT=256,Fs) | 绘制X-Y的相关性函数 |
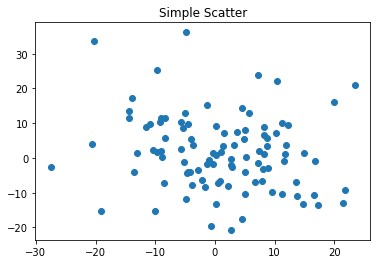
plt.scatter(x,y) | 绘制散点图,其中,x和y长度相同 |
plt.step(x,y,where) | 绘制步阶图 |
plt.hist(x,bins,normed) | 绘制直方图 |
plt.contour(X,Y,Z,N) | 绘制等值图 |
plt.vlines() | 绘制垂直图 |
plt.stem(x,y,linefmt,markerfmt) | 绘制柴火图 |
plt.plot_date() | 绘制数据日期 |
pyplot饼图的绘制
pyplot直方图的绘制
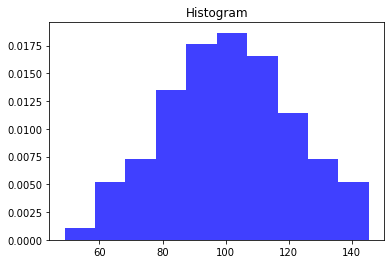
直方图可以很清晰的看出,一个数组在最低和最高之间个数的变化;可以归一化,协调,看到个数层面,取值层面的分布
pyplot极坐标图的绘制
pyplot散点图的绘制

- 作者:铃溪
- 链接:https://lingxi.mozzai.top/article/992c052d-000d-44ab-bd63-cb826d193771
- 声明:本文采用 CC BY-NC-SA 4.0 许可协议,转载请注明出处。